1) One limitation of Swivel is that the original data is not available, only the plots. ManyEyes does not have that limitation.
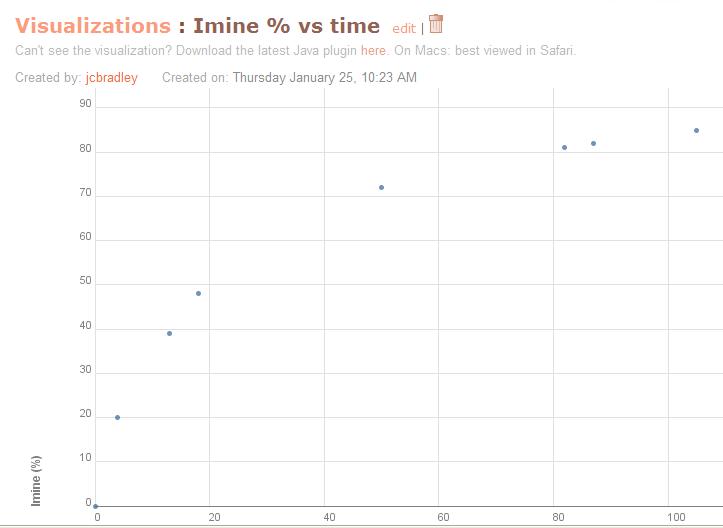
2) As I have done above, it is possible to link to specific views or data in ManyEyes but the user can quickly run a different visualization on the fly just by picking a graph type and variable. This is really where I see the usefulness - that it should be possible to quickly get new insights on experiments by viewing the relationships between variables that one would normally not bother to plot and upload.
3) Make sure to create a dummy first column called something like observations - ManyEyes does not include the first column in the list of variables.
4) It is possible to show the relationship of 3 variables - x, y and point size.
5) Scatter plots do not currently allow multiple lines, trendline calculation or zooming in - that would be really useful.
Tidak ada komentar:
Posting Komentar